09
PortScan — Probe Any Server Port to See if It’s Listening
Need to know if a TCP/UDP port is open? PortScan gives you a fast, reliable answer with clear states (open, closed, filtered), timeouts, and practical troubleshooting tips for DevOps, support, and security teams.
Finding out whether a service is reachable should be simple. When deployments run late or an incident drags on, the last thing you need is guesswork about whether a firewall is blocking traffic, the daemon isn’t bound, or DNS quietly broke. PortScan solves that with one clear job: probe a server to see if the selected port is listening. Point it at a host and port, and you’ll know—fast—whether the door is open, shut, or something in the middle is filtering your packets.
Below you’ll find a friendly, SEO-ready guide to PortScan: what it is, when to use it, how results are determined, common pitfalls, and a practical checklist to troubleshoot stubborn connections. This article is written from scratch to keep it fully original and safe for your site.
What is PortScan?
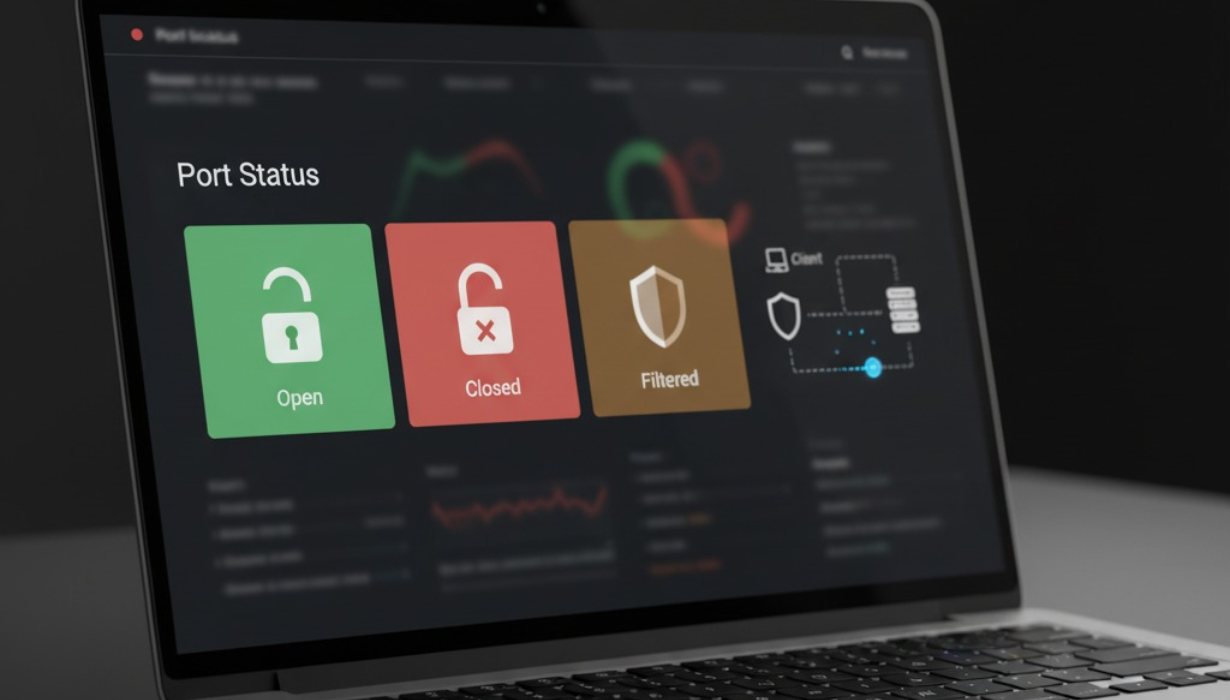
PortScan is a lightweight network check that answers a single question: is a specific service on a specific host reachable right now? You choose a target (hostname or IP) and a port number (like 22 for SSH, 80 for HTTP, 443 for HTTPS, 5432 for PostgreSQL, 3306 for MySQL). PortScan sends a small test and evaluates the response to label the port as:
- Open (listening): the target accepted the connection.
- Closed: the target actively refused the connection; nothing is listening.
- Filtered: a device (firewall, security group, proxy) blocked or dropped the probe before it reached the service.
It’s the fastest way to validate network reachability during rollouts, incident response, or routine health checks.
When to use PortScan
- Incident triage: Confirm whether an outage is network-level (blocked port) or application-level (service up but returning errors).
- Post-deploy checks: After pushing a new build, verify the port is actually listening on the intended interface.
- Firewall audits: Validate that security group rules and ACLs allow traffic from the right sources to the right destinations.
- Migrations & cutovers: Before flipping DNS or switching load balancers, ensure the new backend ports are reachable.
- Customer support: Quickly test connectivity to third-party APIs or databases your app depends on.
- Security hygiene: Discover accidentally exposed services and confirm that nonessential ports are closed.
How PortScan determines a result (plain-English)
PortScan attempts a network handshake to the host:port you specify and watches how the target (or something on the path) responds.
- Open: The target replies in a way that confirms a service is listening. For TCP, this means the handshake is accepted.
- Closed: The host says “no service here,” often by immediately refusing the connection.
- Filtered: There’s no definitive yes/no because a firewall dropped or blocked the attempt. You see timeouts, unreachable signals, or other signs of interference.
For UDP, which is connectionless, “open” often means “no error returned and the service later responds,” while “closed” is typically an explicit unreachable message. Because many devices drop UDP silently, “filtered” is common if the path isn’t allowed.
Interpreting results (and what to do next)
If the port is open
- The service is reachable from where you tested.
- Next steps: confirm the application itself is healthy (e.g., check HTTP status pages, database auth, or app logs). Reachability ≠ correctness.
If the port is closed
- No service is bound to that port or it’s listening on a different address (e.g., localhost only).
- Next steps: check service status, binding address, and configuration. Validate that the process is running and listening on the right interface and port.
If the port is filtered
- A firewall, security group, or network policy is blocking or dropping traffic.
- Next steps: review inbound rules on the target, outbound rules on the source, any middleboxes (VPC NACLs, corporate firewalls), and routing. Confirm that the source IP is on the allowlist and that the correct protocol (TCP/UDP) is permitted.
Best practices for accurate checks
- Validate the target first: Resolve the hostname and confirm the IP is expected (watch for stale DNS or split-horizon mismatches).
- Confirm the protocol: Know whether your service speaks TCP or UDP; the wrong assumption will mislead results.
- Test from the right place: Connectivity can be allowed from one network and blocked from another. Probe from the same environment your app uses (e.g., VPC subnet, office VPN).
- Mind IPv4 vs. IPv6: Ensure you’re probing the address family actually in use. Dual-stack setups can pass v4 and fail v6 (or the reverse).
- Set sensible timeouts: Too short produces false “filtered” results on latent links; too long slows triage.
- Avoid flooding: Rapid, repeated probes may trigger rate limits or intrusion detection. Slow down and spread requests when scanning many ports.
- Document expected states: Keep a runbook listing which ports should be open on each role (web, app, DB) so you can compare fact to intent.
Typical scenarios (and how PortScan helps)
1) New service won’t start
- Symptom: Port shows as closed.
- Likely cause: The application isn’t listening or is bound to 127.0.0.1 instead of the server’s public or internal interface.
- Action: Fix the bind address or service config; restart; re-probe.
2) Works from one network, fails from another
- Symptom: Open from the same VPC; filtered from your laptop.
- Likely cause: Security group allows internal traffic but blocks external.
- Action: Add an allow rule for your source (or use a bastion/VPN), then confirm again.
3) Random timeouts under load
- Symptom: Intermittent filtered results.
- Likely cause: Middlebox rate limiting or connection tracking exhaustion.
- Action: Check firewall logs and connection tables. Increase limits or reduce burstiness.
4) Migrated DNS but traffic still hits the old host
- Symptom: Port is open on old server but closed on new one.
- Likely cause: DNS propagation delay, stale resolver cache, or TTL misconfiguration.
- Action: Verify authoritative records, purge caches, and ensure the new host is actually listening.
5) UDP service appears dead
- Symptom: No reply; result looks filtered.
- Likely cause: Silent drops are common with UDP; some services only reply to valid payloads.
- Action: Confirm firewall rules for UDP specifically and test with application-level checks where possible.
Security, ethics, and legal considerations
Port checks are a normal part of operations, but they still touch access controls, so follow simple rules:
- Scan only what you own or have permission to test. Unauthorized probing can violate policies or laws.
- Keep probes narrow and purposeful. Target specific ports and hosts you’re actively troubleshooting.
- Log and disclose appropriately. If you’re scanning as part of an assessment, document scope and timing for audit trails.
- Respect rate limits. High-volume scans can look like hostile behavior to IDS/IPS systems.
- Close what you don’t need. Use results to reduce attack surface by turning off unnecessary services or restricting exposure.
Troubleshooting checklist (copy-friendly)
- Confirm the destination: Is the hostname pointing to the right IP? Compare DNS to your expected address.
- Pick the correct protocol: TCP vs. UDP. Many services only speak one.
- Check service health: Is the daemon running? Is it listening on the intended port and interface?
- Test from the right vantage point: VPC instance, office network, VPN—replicate the real path.
- Review access controls: Security groups, NACLs, firewalls, on-host rules (like iptables), and proxies.
- Consider middleboxes: Load balancers, NAT gateways, WAFs, and SD-WAN links can all influence reachability.
- Tune timeouts: Increase slightly on high-latency links to avoid false “filtered” readings.
- Re-test both directions if relevant: Some flows require symmetric rules (e.g., return traffic on stateful firewalls).
- Log & compare: Keep a known-good baseline for each environment to catch regressions early.
How PortScan fits alongside other checks
- Ping/ICMP tests: Answer “is the host up?” but say nothing about application ports. Firewalls often block ICMP even when ports are open.
- HTTP health checks: Great for app-level status, but they assume the port is reachable already.
- Full vulnerability scans: Deep security assessments take longer and go far beyond reachability. Use PortScan first to confirm basics, then escalate if needed.
- Service logs & metrics: Once reachability is confirmed, logs tell you why the app misbehaves; PortScan tells you whether you can reach it.
Port hygiene: harden what you expose
Good results from PortScan should feed directly into your hardening routine:
- Principle of least exposure: Only open the ports you need, to the sources that need them.
- Segment environments: Keep staging and production rules separate and explicit.
- Prefer private paths: Where possible, expose services through private networks, zero-trust gateways, or VPNs rather than the public internet.
- Rotate and review: Ports drift open during fast changes; schedule periodic reviews to keep your posture clean.
FAQ
What’s the difference between “closed” and “filtered”?
“Closed” means the target actively refused your connection—there’s no service listening. “Filtered” means a firewall or rule blocked the probe, so PortScan can’t tell whether something is listening behind it.
Does an “open” result guarantee the service is healthy?
No. “Open” only confirms reachability. The service might still return errors or be misconfigured. Pair PortScan with application-level checks.
Should I test TCP or UDP?
Use the transport your service uses. Web servers, SSH, and most databases use TCP. Some DNS, streaming, and real-time protocols can use UDP.
Why do results differ between my laptop and a server in the same cloud?
Access rules can be source-specific. A port can be open for traffic from inside a VPC but blocked to the outside world.
Is frequent scanning risky?
High-rate scanning can trigger alarms or rate limits. Keep probes intentional, respect policies, and throttle when testing multiple ports.
Can PortScan help with load balancers or proxies?
Yes. It verifies that the front door is reachable. If the port is open on the load balancer but your app still fails, investigate backend targets, health checks, and routing.
Suggested hero image & alt text
Concept: A minimalist network dashboard with a single prominent “Port status” card showing three states—Open (green), Closed (gray), Filtered (amber)—with a stylized server icon and a dotted path representing the probe. Neutral colors, no vendor logos, clean and modern.
Alt text: “Interface card displaying port status states—open, closed, filtered—used to check if a server port is listening.”
Final takeaway
Whether you’re rolling out a feature at 3 a.m. or debugging a flaky service in the middle of the day, PortScan gives you a fast, trustworthy answer to the most basic connectivity question: is the port listening? Use it to separate network issues from app issues, to validate firewall changes, and to keep exposed services to a minimum. Clear results, fewer blind spots, and smoother operations—exactly what a lean team needs.
Contact
Missing something?
Feel free to request missing tools or give some feedback using our contact form.
Contact Us